Monitoring and Observability
Monitor EmailEngine health, performance, and activity with built-in health check endpoints, Prometheus metrics, and integrations with popular observability platforms.
Overview
EmailEngine provides comprehensive monitoring capabilities:
- Health Check Endpoints - Simple HTTP endpoints for uptime monitoring
- Prometheus Metrics - Detailed metrics for Prometheus/Grafana stack
- Performance Indicators - Track message processing, connections, and queue health
- Custom Alerting - Set up alerts based on key metrics
- Bull Board Dashboard - Visual queue monitoring (see Webhooks Guide)
Health Check Endpoints
Basic Health Check
Use the /health endpoint to verify EmailEngine is running:
curl http://localhost:3000/health
Response when healthy:
{
  "success": true
}
The health check verifies:
- All IMAP workers are available
- Redis database is accessible and responding
Detailed Status Check
Get more detailed status information:
curl http://localhost:3000/v1/stats \
  -H "Authorization: Bearer YOUR_TOKEN"
Response includes:
{
  "version": "2.61.1",
  "license": "MIT",
  "accounts": 15,
  "node": "24.0.0",
  "redis": "7.2.4",
  "counters": {
    "events:messageNew": 1523,
    "webhooks:messageNew": 1450,
    "apiReq:GET /v1/stats": 234
  },
  "queues": {
    "notify": {
      "active": 2,
      "delayed": 0,
      "waiting": 0,
      "paused": 0,
      "isPaused": false,
      "total": 2
    },
    "submit": {
      "active": 1,
      "delayed": 0,
      "waiting": 5,
      "paused": 0,
      "isPaused": false,
      "total": 6
    },
    "documents": {
      "active": 0,
      "delayed": 0,
      "waiting": 0,
      "paused": 0,
      "isPaused": false,
      "total": 0
    }
  },
  "connections": {
    "connected": 14,
    "connecting": 1
  }
}
Prometheus Metrics
Setting Up Prometheus
EmailEngine exposes Prometheus metrics at /metrics endpoint.
Step 1: Create Metrics Token
- Navigate to Settings → Access Tokens in EmailEngine UI
- Click Create new
- Uncheck All scopes
- Check only Metrics scope
- Create token and save it
Step 2: Configure Prometheus
Add EmailEngine as a scraping target in prometheus.yml:
scrape_configs:
  - job_name: 'emailengine'
    scrape_interval: 10s
    metrics_path: '/metrics'
    scheme: 'http'
    authorization:
      type: Bearer
      credentials: 795f623527c16d617b106...  # Your metrics token
    static_configs:
      - targets: ['127.0.0.1:3000']
For multiple EmailEngine instances:
scrape_configs:
  - job_name: 'emailengine'
    scrape_interval: 10s
    metrics_path: '/metrics'
    scheme: 'https'
    authorization:
      type: Bearer
      credentials: YOUR_METRICS_TOKEN
    static_configs:
      - targets:
        - 'ee-prod-01.example.com:3000'
        - 'ee-prod-02.example.com:3000'
        - 'ee-prod-03.example.com:3000'
        labels:
          environment: 'production'
Step 3: Restart Prometheus
# SystemD
sudo systemctl restart prometheus

# Docker
docker restart prometheus
Step 4: Verify
Check Prometheus targets page:
http://localhost:9090/targets
EmailEngine should appear with status UP.
Available Metrics
EmailEngine exposes these Prometheus metrics:
Connection Metrics
# IMAP connections by status
imap_connections{status="connected"}
imap_connections{status="connecting"}
imap_connections{status="authenticationError"}
imap_connections{status="connectError"}
imap_connections{status="syncing"}
imap_connections{status="disconnected"}

# IMAP responses
imap_responses{response="OK"}
imap_responses{response="OK",code="CAPABILITY"}

# IMAP traffic
imap_bytes_sent
imap_bytes_received
Webhook and Event Metrics
# Webhooks sent by event and status
webhooks{event="messageNew",status="success"}
webhooks{event="messageUpdated",status="success"}
webhooks{event="messageDeleted",status="success"}

# Events fired
events{event="messageNew"}
events{event="messageUpdated"}

# Webhook request duration (buckets in milliseconds)
webhook_req_bucket{le="100"}
webhook_req_bucket{le="1000"}
webhook_req_bucket{le="10000"}
webhook_req_sum
webhook_req_count
Queue Metrics
# Queue sizes by state
queue_size{queue="notify",state="waiting"}
queue_size{queue="submit",state="active"}
queue_size{queue="documents",state="delayed"}

# Processed job counts
queues_processed{queue="notify"}
queues_processed{queue="submit"}
API Metrics
# API calls by method and status
api_call{method="post",route="/v1/account/:account/submit",statusCode="200"}
api_call{method="get",route="/v1/account/:account",statusCode="200"}
System Metrics
# Worker threads
threads{type="imap"}
threads{type="webhooks"}

# Configuration
emailengine_config{version="v2.61.1"}
emailengine_config{config="workersImap"}
Note: Memory usage, CPU usage, and uptime metrics are available through standard Node.js metrics exporters if needed.
Complete Prometheus Metrics Reference
The following tables provide a comprehensive reference of all Prometheus metrics exposed by EmailEngine:
Worker and Thread Metrics
| Metric Name | Type | Labels | Description |
|---|---|---|---|
thread_starts | Counter | - | Total number of worker threads started |
thread_stops | Counter | - | Total number of worker threads stopped |
threads | Gauge | type, recent | Current worker thread count by type (api, imap, webhooks, documents, smtp, submit, main, imapProxy) |
unresponsive_workers | Gauge | - | Number of unresponsive worker threads |
IMAP Connection Metrics
| Metric Name | Type | Labels | Description |
|---|---|---|---|
imap_connections | Gauge | status | IMAP connection count by status (connected, connecting, authenticationError, connectError, syncing, disconnected) |
imap_responses | Counter | response, code | IMAP server response counts by response type and code |
imap_bytes_sent | Counter | - | Total bytes sent over IMAP connections |
imap_bytes_received | Counter | - | Total bytes received over IMAP connections |
OAuth2 Metrics
| Metric Name | Type | Labels | Description |
|---|---|---|---|
oauth2_token_refresh | Counter | status, provider, statusCode | OAuth2 access token refresh attempts by status (success, error), provider, and HTTP status code |
oauth2_api_request | Counter | status, provider, statusCode | OAuth2 API requests (MS Graph, Gmail API) by status, provider, and HTTP status code |
outlook_subscriptions | Gauge | status | Microsoft Graph webhook subscription states (valid, expired, failed) |
Webhook Metrics
| Metric Name | Type | Labels | Description |
|---|---|---|---|
webhooks | Counter | status, event | Webhook delivery count by status (success, failure) and event type |
events | Counter | event | Internal events fired by event type |
webhook_req | Histogram | - | Webhook request duration histogram (buckets: 100, 250, 500, 750, 1000, 2500, 5000, 7500, 10000, 60000 ms) |
Queue Metrics
| Metric Name | Type | Labels | Description |
|---|---|---|---|
queue_size | Gauge | queue, state | Queue size by queue name (notify, submit, documents) and state (waiting, active, delayed, paused) |
queues_processed | Counter | queue, status | Processed job count by queue and status (completed, failed) |
API Metrics
| Metric Name | Type | Labels | Description |
|---|---|---|---|
api_call | Counter | method, statusCode, route | API call count by HTTP method, status code, and route pattern |
License Metrics
| Metric Name | Type | Labels | Description |
|---|---|---|---|
license_days_remaining | Gauge | - | Days until license expires (-1 for lifetime, 0 for no license) |
Configuration Metrics
| Metric Name | Type | Labels | Description |
|---|---|---|---|
emailengine_config | Gauge | version, config | Configuration values including version and settings like uvThreadpoolSize |
Redis Metrics
| Metric Name | Type | Labels | Description |
|---|---|---|---|
redis_version | Gauge | version | Redis server version |
redis_uptime_in_seconds | Gauge | - | Redis server uptime in seconds |
redis_latency | Gauge | - | Redis PING latency in nanoseconds |
redis_rejected_connections_total | Gauge | - | Number of connections rejected by Redis |
redis_config_maxclients | Gauge | - | Maximum configured client connections for Redis |
redis_connected_clients | Gauge | - | Current number of connected Redis clients |
redis_slowlog_length | Gauge | - | Number of entries in the Redis slow log |
redis_commands_duration_seconds_total | Gauge | - | Total seconds spent processing Redis commands |
redis_commands_processed_total | Gauge | - | Total number of Redis commands processed |
redis_keyspace_hits_total | Gauge | - | Number of successful Redis key lookups |
redis_keyspace_misses_total | Gauge | - | Number of failed Redis key lookups |
redis_evicted_keys_total | Gauge | - | Number of keys evicted due to maxmemory limit |
redis_memory_used_bytes | Gauge | - | Total bytes allocated by Redis |
redis_memory_max_bytes | Gauge | - | Redis maxmemory configuration value |
redis_mem_fragmentation_ratio | Gauge | - | Ratio between used_memory_rss and used_memory |
redis_key_count | Gauge | db | Key count per Redis database |
redis_last_save_time | Gauge | - | Unix timestamp of the last RDB save |
redis_instantaneous_ops_per_sec | Gauge | - | Redis operations per second throughput |
redis_command_runs | Gauge | command | Redis command execution counts by command name |
redis_command_runs_fail | Gauge | command, status | Failed Redis command counts by command and status |
Metric Labels Reference
| Label | Values | Description |
|---|---|---|
status | connected, connecting, authenticationError, connectError, syncing, disconnected, success, failure, error | Connection or operation status |
event | messageNew, messageUpdated, messageDeleted, messageBounce, messageComplaint, accountAdded, etc. | Webhook event type |
queue | notify, submit, documents | Queue name |
state | waiting, active, delayed, paused | Queue job state |
type | api, imap, webhooks, documents, smtp, submit, main, imapProxy | Worker thread type |
provider | gmail, outlook, mailRu, gmailService | OAuth2 provider |
method | get, post, put, delete, patch | HTTP method |
route | /v1/account/:account, /v1/account/:account/submit, etc. | API route pattern |
response | OK, NO, BAD | IMAP response type |
code | CAPABILITY, PERMANENTFLAGS, etc. | IMAP response code |
Grafana Dashboard
EmailEngine provides a pre-built Grafana dashboard for comprehensive monitoring. The dashboard is available in the EmailEngine repository and can be imported directly into your Grafana instance.
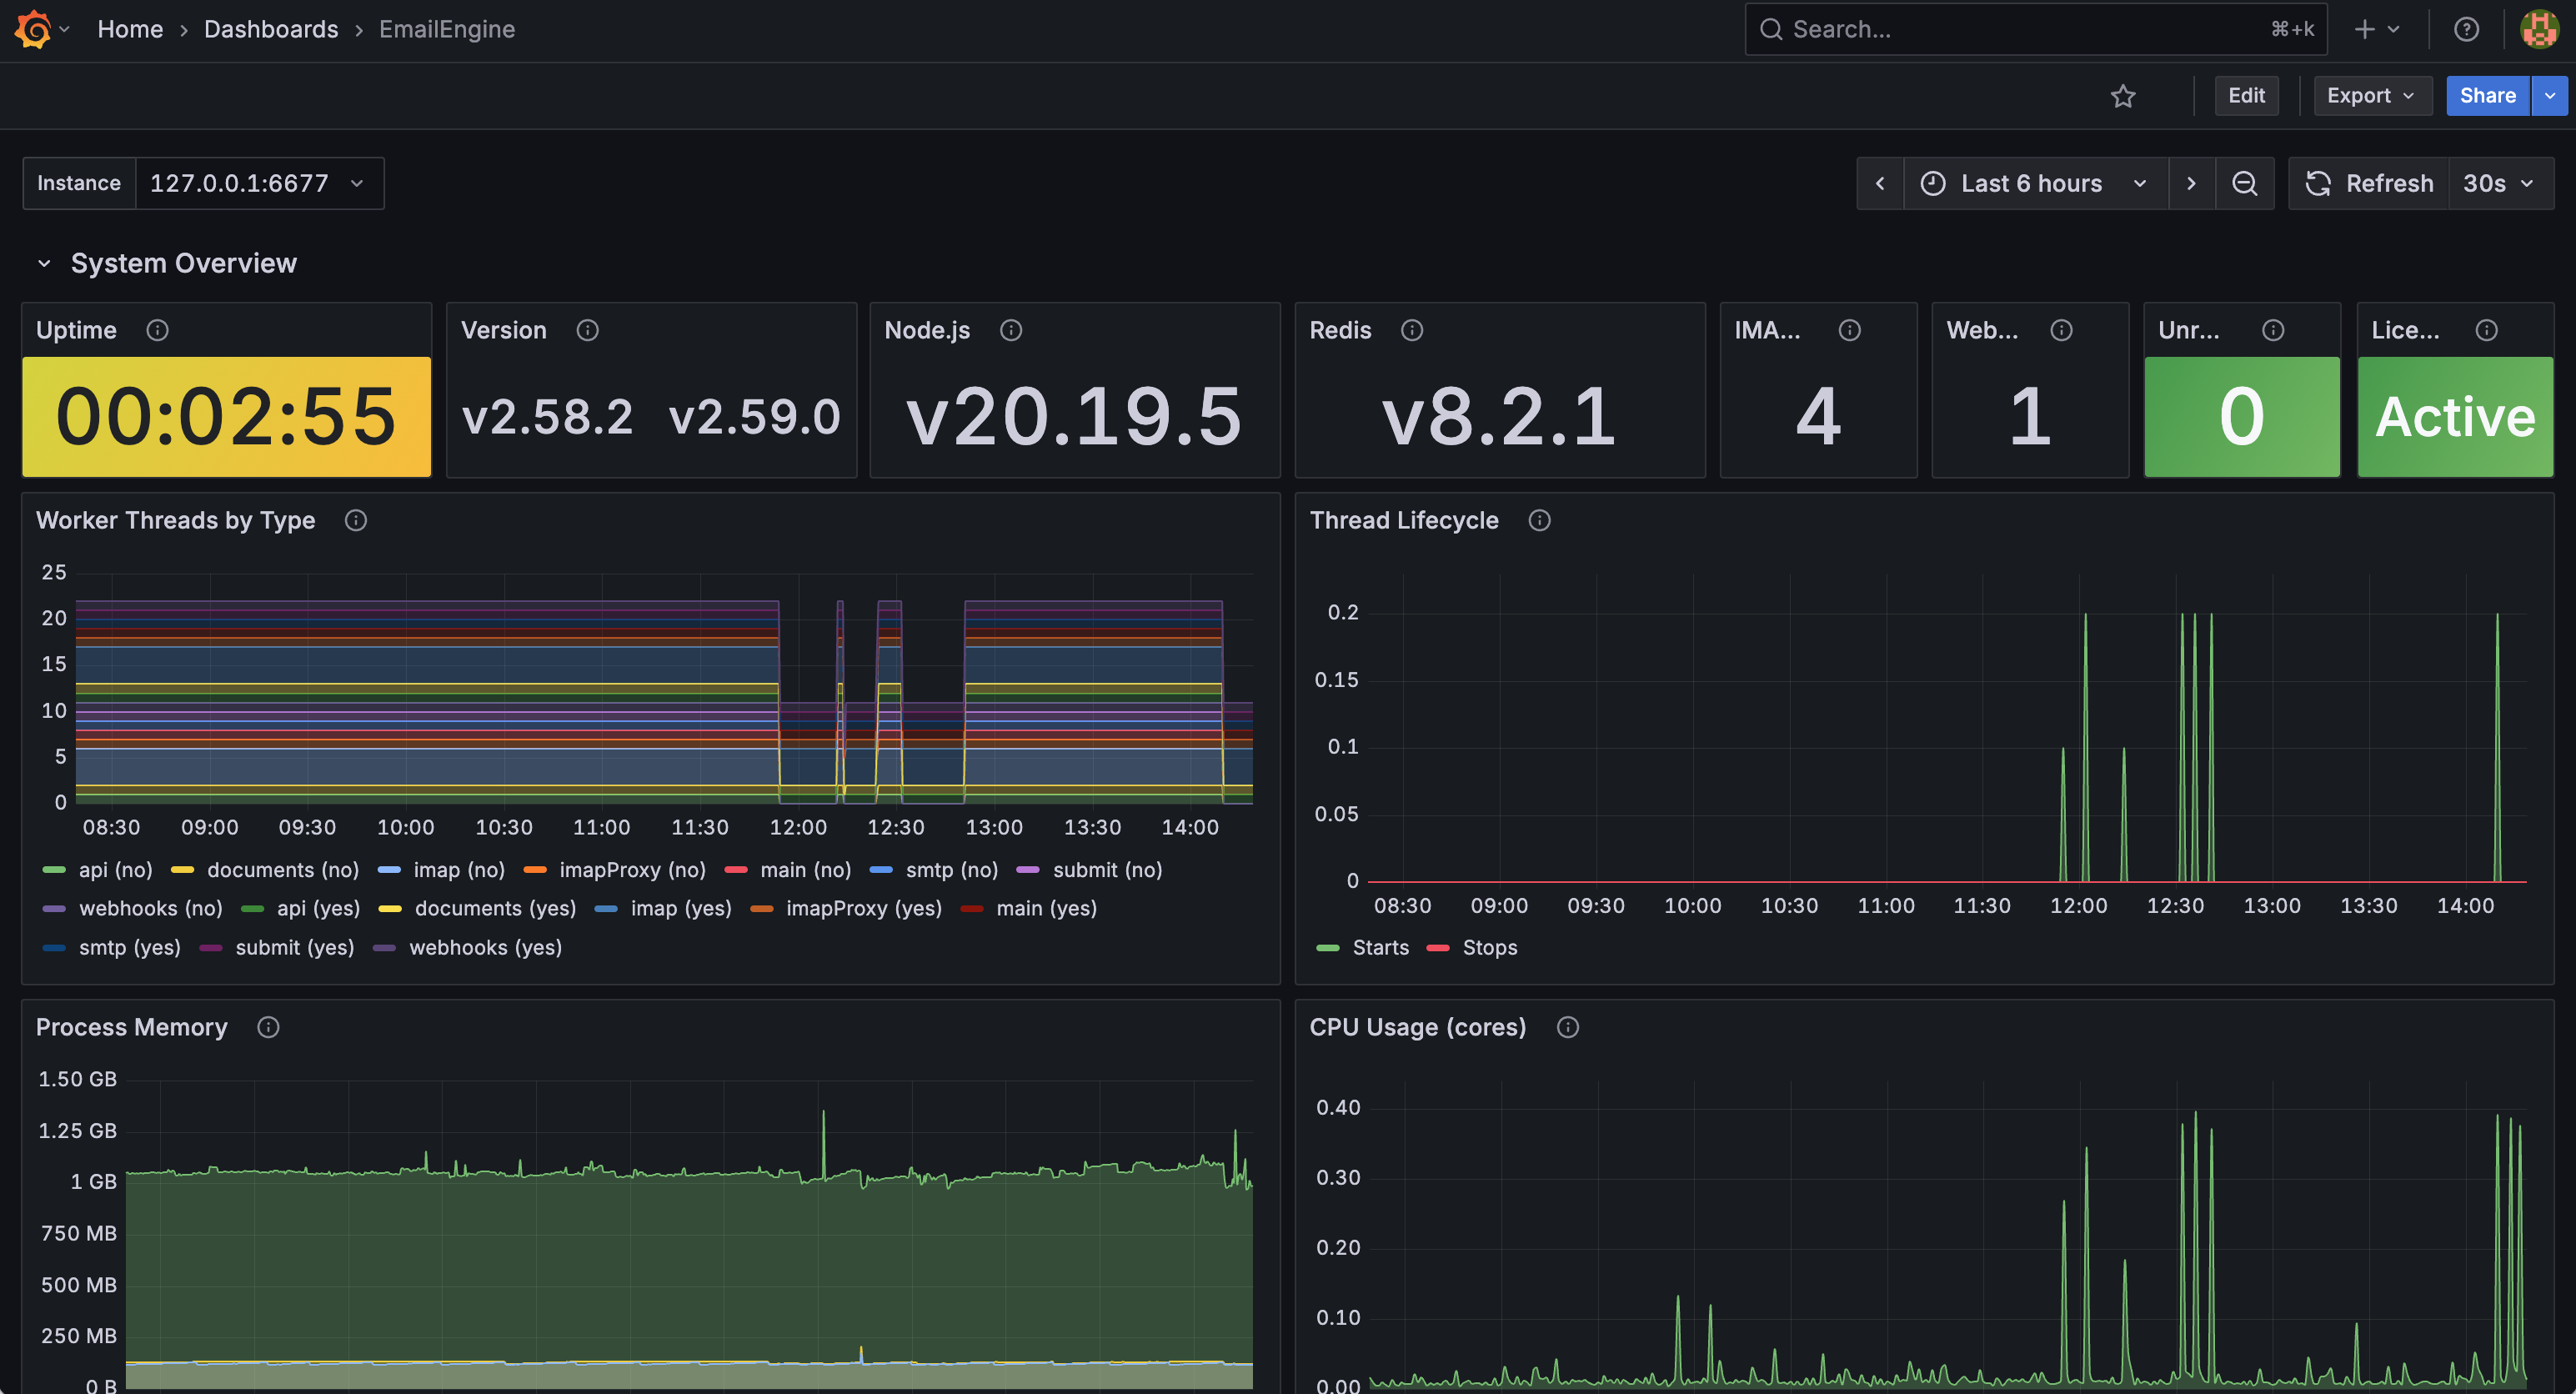 EmailEngine monitoring dashboard showing system overview, worker threads, memory, and CPU usage
Dashboard Features
The official EmailEngine Grafana dashboard includes the following sections:
System Overview
- Uptime with color-coded thresholds (yellow if under 1 hour, green if stable)
- EmailEngine version and Node.js runtime version
- Redis version
- IMAP and webhook worker thread counts
- Unresponsive workers alert indicator
- License status with expiry warnings
Worker Threads
- Worker threads by type (API, IMAP, webhooks, documents, SMTP, submit, main, imapProxy)
- Thread lifecycle monitoring (starts and stops over time)
- Differentiation between recently started threads and established connections
Performance Metrics
- Process memory usage (RSS, heap total, heap used)
- CPU usage per core
API Traffic
- Request distribution by HTTP method (GET, POST, PUT, DELETE)
- Response status code breakdown (2xx, 4xx, 5xx)
Webhooks
- Webhook delivery success vs. failure rates
- Events distribution by type
- Request latency heatmap showing response time distribution
Queue Monitoring
- Webhook queue status (waiting, active, delayed jobs)
- Webhook processing completion and failure rates
- Email sending queue status
- Email send attempt outcomes
Account Connections
- Account connection states (connected, connecting, error)
- IMAP response codes (OK, NO, BAD)
- Network bandwidth (inbound/outbound data rates)
- Internal event rates
OAuth2 Integration
- Token refresh success/failure by provider (Microsoft Graph, Gmail)
- API request rates and statuses
- HTTP status code breakdown for failures
- Microsoft Graph subscription status (valid, expired, failed)
Redis Performance
- Memory usage and limits
- Connection pool utilization
- Commands per second throughput
- PING latency
- Slow query log count
- Cache hit ratio
- Uptime and last save time
Installing the Dashboard
Step 1: Add Prometheus Data Source
- Go to Configuration (gear icon) -> Data Sources
- Click Add data source
- Select Prometheus
- Configure the connection:
- URL:
http://localhost:9090(or your Prometheus server address) - Leave other settings at defaults
- URL:
- Click Save & Test to verify the connection
Step 2: Download the Dashboard
Download the dashboard JSON:
curl -L -O https://go.emailengine.app/grafana-dashboard.json
Or download directly from: grafana-dashboard.json
Step 3: Import the Dashboard
- In Grafana, go to Dashboards (four squares icon) -> Import
- Click Upload JSON file and select the downloaded
grafana-dashboard.json - Or paste the JSON content directly into the Import via panel json text area
- Configure the import options:
- Name: EmailEngine (or customize)
- Folder: Select or create a folder
- Prometheus: Select your Prometheus data source
- Click Import
Step 4: Configure the Instance Variable
The dashboard includes an Instance variable for filtering by EmailEngine instance. After importing:
- Click the gear icon on the dashboard to access Settings
- Go to Variables
- Edit the
hostvariable if needed to match your Prometheus labels - The default query
label_values(emailengine_config, instance)should auto-populate with your instances
Dashboard Variables
The dashboard uses these variables for filtering:
| Variable | Description | Default Query |
|---|---|---|
$host | EmailEngine instance filter | label_values(emailengine_config, instance) |
Select different instances from the dropdown at the top of the dashboard to filter all panels.
Custom Dashboard Panels
You can extend the dashboard with custom panels. Here are some useful queries:
Webhook Events Rate
rate(webhooks[5m]) * 60
Shows webhooks per minute.
Webhook Success vs Failure
# Success rate
sum(rate(webhooks{status="success"}[5m])) * 60

# Failure rate
sum(rate(webhooks{status="failure"}[5m])) * 60
IMAP Connections by Status
sum by (status) (imap_connections)
Use with a pie chart or stat panel.
Webhook Response Time (99th percentile)
histogram_quantile(0.99, rate(webhook_req_bucket[5m]))
Result is in milliseconds.
Queue Health
queue_size{queue="notify",state="waiting"}
queue_size{queue="submit",state="waiting"}
Alert if values exceed 100.
Key Metrics to Monitor
Critical Metrics
Monitor these metrics closely in production:
1. Account Connection Health
# Connected accounts
imap_connections{status="connected"}

# Disconnected or errored accounts
imap_connections{status="authenticationError"}
imap_connections{status="connectError"}
imap_connections{status="disconnected"}

# Alert if too many disconnected
2. Webhook Queue Size
# Alert if queue is backing up
queue_size{queue="notify",state="waiting"} > 100
3. Webhook Failure Rate
# Alert if failure rate > 5%
(sum(rate(webhooks{status="failure"}[5m])) /
 sum(rate(webhooks[5m]))) * 100 > 5
4. Webhook Processing Time
# Alert if webhooks are processing slowly (99th percentile > 5 seconds)
# Note: webhook_req buckets are in milliseconds
histogram_quantile(0.99,
  rate(webhook_req_bucket[5m])
) > 5000
5. Queue Processing Rate
# Monitor queue processing rate
rate(queues_processed{queue="notify"}[5m])
rate(queues_processed{queue="submit"}[5m])
Performance Indicators
Track these for performance optimization:
# Webhook events per minute
rate(webhooks[5m]) * 60

# Webhook processing time (median, in milliseconds)
histogram_quantile(0.5,
  rate(webhook_req_bucket[5m])
)

# Queue throughput
rate(queues_processed[5m])

# Active queue jobs
queue_size{state="active"}

# API call rate by endpoint
rate(api_call[5m])
Alerting Setup
Prometheus Alertmanager
Configure alerts in prometheus_rules.yml:
groups:
  - name: emailengine
    interval: 30s
    rules:
      # IMAP connection errors
      - alert: EmailEngineConnectionErrors
        expr: |
          imap_connections{status=~"authenticationError|connectError"} > 5
        for: 5m
        labels:
          severity: warning
        annotations:
          summary: "Multiple IMAP connection errors"
          description: "{{ $value }} accounts with {{ $labels.status }}"

      # Webhook queue backing up
      - alert: EmailEngineWebhookQueueHigh
        expr: queue_size{queue="notify",state="waiting"} > 100
        for: 5m
        labels:
          severity: warning
        annotations:
          summary: "Webhook queue is backing up"
          description: "{{ $value }} webhooks waiting in queue"

      # High webhook failure rate
      - alert: EmailEngineWebhookFailureRate
        expr: |
          (sum(rate(webhooks{status="failure"}[5m])) /
           sum(rate(webhooks[5m]))) > 0.1
        for: 5m
        labels:
          severity: critical
        annotations:
          summary: "High webhook failure rate"
          description: "{{ $value | humanizePercentage }} webhooks failing"

      # EmailEngine down
      - alert: EmailEngineDown
        expr: up{job="emailengine"} == 0
        for: 1m
        labels:
          severity: critical
        annotations:
          summary: "EmailEngine is down"
          description: "EmailEngine on {{ $labels.instance }} is down"

      # Slow webhook processing (buckets are in milliseconds)
      - alert: EmailEngineSlowWebhooks
        expr: |
          histogram_quantile(0.99, rate(webhook_req_bucket[5m])) > 10000
        for: 5m
        labels:
          severity: warning
        annotations:
          summary: "Webhooks processing slowly"
          description: "99th percentile webhook duration: {{ $value }}ms"

      # Queue not processing
      - alert: EmailEngineQueueStalled
        expr: |
          rate(queues_processed[5m]) == 0 and queue_size{state="waiting"} > 0
        for: 10m
        labels:
          severity: critical
        annotations:
          summary: "Queue processing stalled"
          description: "Queue {{ $labels.queue }} has jobs but no processing"
Alertmanager Configuration
Configure notification channels in alertmanager.yml:
global:
  resolve_timeout: 5m

route:
  group_by: ['alertname', 'instance']
  group_wait: 10s
  group_interval: 10s
  repeat_interval: 12h
  receiver: 'email-notifications'
  routes:
    - match:
        severity: critical
      receiver: 'pagerduty'

receivers:
  - name: 'email-notifications'
    email_configs:
      - to: 'ops@example.com'
        from: 'alertmanager@example.com'
        smarthost: 'smtp.example.com:587'
        auth_username: 'alerts'
        auth_password: 'secret'

  - name: 'pagerduty'
    pagerduty_configs:
      - service_key: 'YOUR_PAGERDUTY_KEY'

  - name: 'slack'
    slack_configs:
      - api_url: 'https://hooks.slack.com/services/YOUR/WEBHOOK'
        channel: '#emailengine-alerts'
        title: 'EmailEngine Alert'
Integration with Observability Platforms
Datadog
Monitor EmailEngine with Datadog APM:
// Pseudo code - implement in your preferred language

// Initialize Datadog tracer
DATADOG_INIT({
  service: 'emailengine',
  env: ENV['NODE_ENV'],
  version: APP_VERSION
})

// Initialize StatsD client
statsd = STATSD_CLIENT({
  host: 'datadog-agent',
  port: 8125,
  prefix: 'emailengine.'
})

// Track custom events
statsd.INCREMENT('accounts.connected')
statsd.GAUGE('queue.size', queue_size)
statsd.TIMING('webhook.duration', duration)
New Relic
Monitor with New Relic APM:
# Install agent
npm install newrelic

# Configure newrelic.js
# Start with agent
node -r newrelic server.js
Elastic APM
Monitor with Elasticsearch APM by initializing the APM agent with your language's elastic-apm library, providing service name, server URL, and environment configuration.
Bull Board Dashboard
EmailEngine uses Bull queues. Monitor them visually with Bull Board.
Bull Board is always enabled and available at:
http://localhost:3000/admin/bull-board
You can also access it from the dashboard sidebar under Tools → Bull Board.
See detailed queue monitoring in Webhooks Guide - Debugging Section.
Log-Based Monitoring
Structured Logging
EmailEngine logs in JSON format (Pino). Parse logs for monitoring:
# Count errors per hour
cat emailengine.log | \
  grep '"level":50' | \
  jq -r '.time' | \
  cut -c1-13 | \
  uniq -c

# Track webhook failures
cat emailengine.log | \
  grep 'webhook.*failed' | \
  jq -r '{time: .time, account: .account, error: .err.message}'
ELK Stack Integration
Ship logs to Elasticsearch:
Filebeat configuration:
filebeat.inputs:
  - type: log
    enabled: true
    paths:
      - /var/log/emailengine/*.log
    json.keys_under_root: true
    json.add_error_key: true
    fields:
      service: emailengine
      environment: production

output.elasticsearch:
  hosts: ["localhost:9200"]
  index: "emailengine-%{+yyyy.MM.dd}"
Kibana Dashboard Queries:
# Error rate over time
level:50 AND service:emailengine

# Webhook failures
msg:"webhook failed" AND service:emailengine

# Account connection issues
msg:"connection error" AND service:emailengine
Grafana Loki
Ship logs to Loki with Promtail:
server:
  http_listen_port: 9080

positions:
  filename: /tmp/positions.yaml

clients:
  - url: http://loki:3100/loki/api/v1/push

scrape_configs:
  - job_name: emailengine
    static_configs:
      - targets:
          - localhost
        labels:
          job: emailengine
          __path__: /var/log/emailengine/*.log
    pipeline_stages:
      - json:
          expressions:
            level: level
            message: msg
            account: account
      - labels:
          level:
          account:
Monitoring Best Practices
1. Set Appropriate Thresholds
Don't alert on noise:
# Bad - too sensitive
queue_size{state="waiting"} > 0

# Good - meaningful threshold
queue_size{state="waiting"} > 100 for 5m
2. Monitor Trends, Not Just Absolutes
# Track rate of change for webhooks
rate(webhooks{status="failure"}[30m])
3. Create Composite Alerts
# Alert only if multiple conditions met
(queue_size{queue="notify",state="waiting"} > 100) AND
(sum(rate(webhooks{status="failure"}[5m])) > 0.1)
4. Use Alert Grouping
Group related alerts to avoid alarm fatigue:
route:
  group_by: ['alertname', 'instance']
  group_wait: 30s
  group_interval: 5m
5. Document Runbooks
Include runbook links in alert annotations:
annotations:
  summary: "Webhook queue backing up"
  description: "{{ $value }} webhooks waiting"
  runbook: "https://wiki.example.com/emailengine/webhook-queue-backup"
Health Check Scripts
Simple Uptime Check
#!/bin/bash
# check-emailengine-health.sh

RESPONSE=$(curl -s -o /dev/null -w "%{http_code}" http://localhost:3000/health)

if [ "$RESPONSE" != "200" ]; then
  echo "EmailEngine health check failed: HTTP $RESPONSE"
  exit 1
fi

echo "EmailEngine is healthy"
exit 0
Comprehensive Check
#!/bin/bash
# comprehensive-health-check.sh

TOKEN="$1"
HOST="${2:-localhost:3000}"

# Check basic health endpoint (no auth required)
HEALTH=$(curl -s http://$HOST/health)
SUCCESS=$(echo $HEALTH | jq -r '.success')

if [ "$SUCCESS" != "true" ]; then
  echo "CRITICAL: EmailEngine health check failed"
  exit 2
fi

# Get detailed stats (requires token)
STATS=$(curl -s -H "Authorization: Bearer $TOKEN" \
  "http://$HOST/v1/stats")

# Check connected accounts
CONNECTED=$(echo $STATS | jq -r '.connections.connected // 0')
TOTAL=$(echo $STATS | jq -r '.accounts')

if [ "$TOTAL" -gt 0 ]; then
  PERCENT=$(echo "scale=2; $CONNECTED * 100 / $TOTAL" | bc)
  if (( $(echo "$PERCENT < 95" | bc -l) )); then
    echo "WARNING: Only $PERCENT% accounts connected ($CONNECTED/$TOTAL)"
    exit 1
  fi
fi

echo "OK: EmailEngine healthy - $CONNECTED/$TOTAL accounts connected"
exit 0
Nagios/Icinga Plugin
#!/bin/bash
# check_emailengine

TOKEN="$1"
HOST="${2:-localhost:3000}"

STATS=$(curl -s -H "Authorization: Bearer $TOKEN" \
  "http://$HOST/v1/stats")

# Check webhook queue (notify queue handles webhooks)
QUEUE_WAITING=$(echo $STATS | jq -r '.queues.notify.waiting // 0')
QUEUE_TOTAL=$(echo $STATS | jq -r '.queues.notify.total // 0')
if [ "$QUEUE_WAITING" -gt 100 ]; then
  echo "CRITICAL: Webhook queue size $QUEUE_WAITING | queue=$QUEUE_WAITING"
  exit 2
fi

# Check queue status
QUEUE_PAUSED=$(echo $STATS | jq -r '.queues.notify.isPaused')
if [ "$QUEUE_PAUSED" = "true" ]; then
  echo "WARNING: Webhook queue is paused | paused=1"
  exit 1
fi

echo "OK: EmailEngine operational | queue_waiting=$QUEUE_WAITING queue_total=$QUEUE_TOTAL"
exit 0